Role: UI/UX Designer (Project Lead)
Tools: Figma
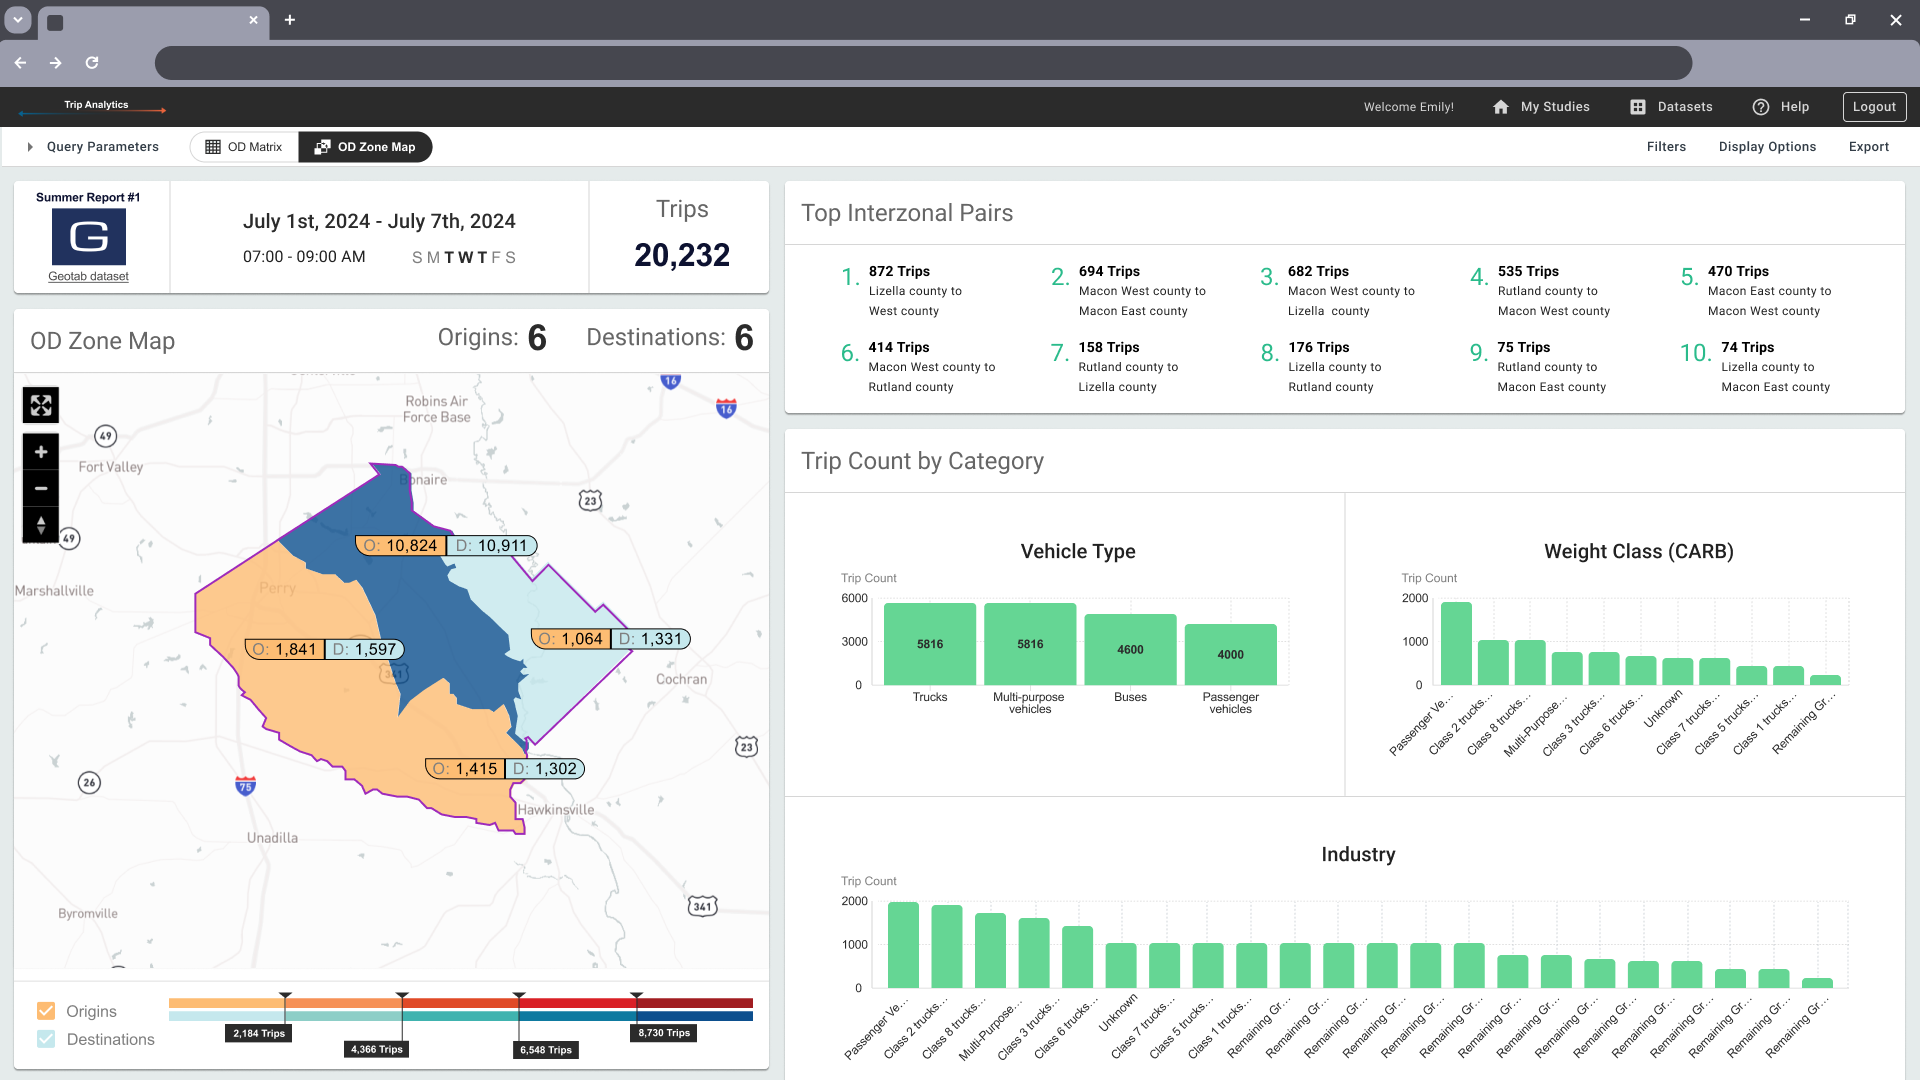
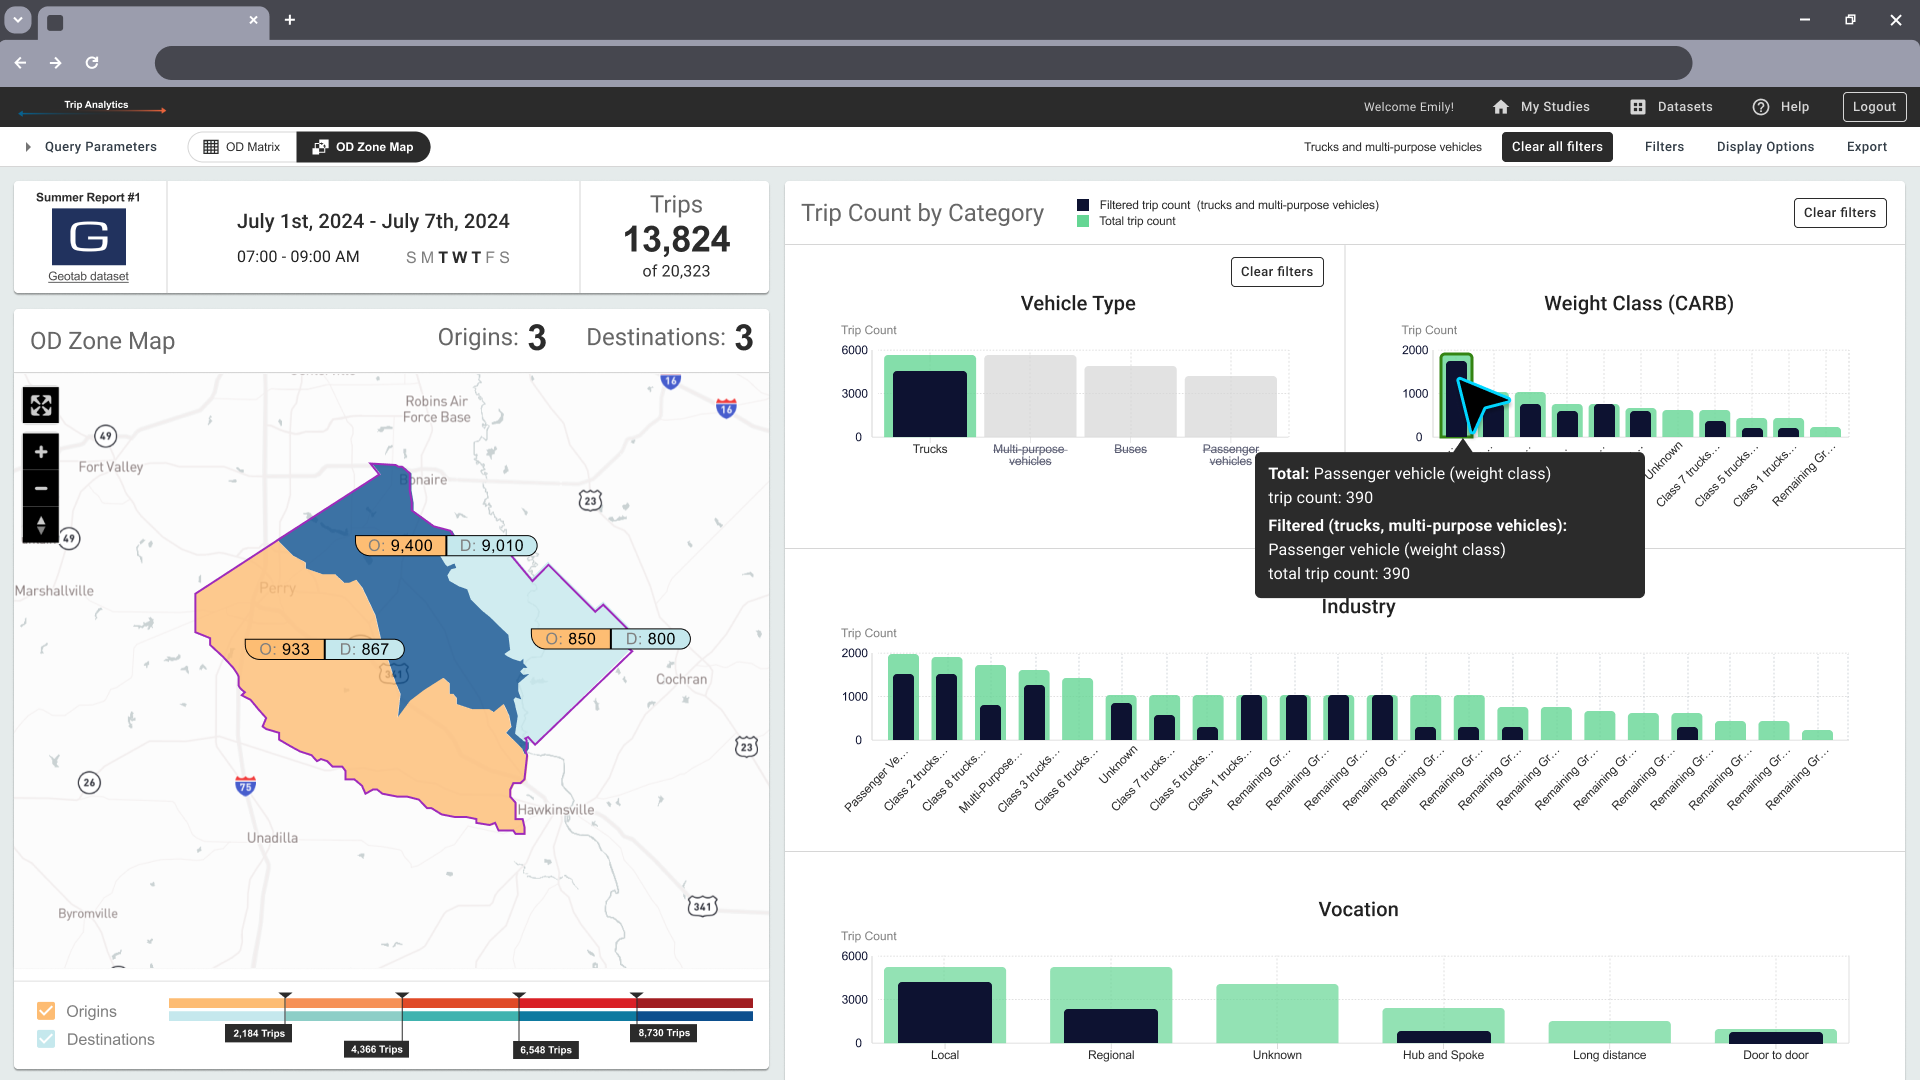
Project: The task was to design a dashboard displaying the journey of freight trucks carrying Geotab sensors. The client wanted interactive features that created visual connections between the charts, table, and map. Ultimately, my layout and interaction framework went on to shape four additional dashboards built on different datasets, establishing a scalable foundation for future products. The final product is used by several government agencies, including the Departments of Transportation in Texas, Georgia, Nevada, and Massachusetts.
Design: Because conferences and live demos are an important part of the client’s business model, I wanted the new dashboard to be visually engaging. It needed to draw people in quickly.
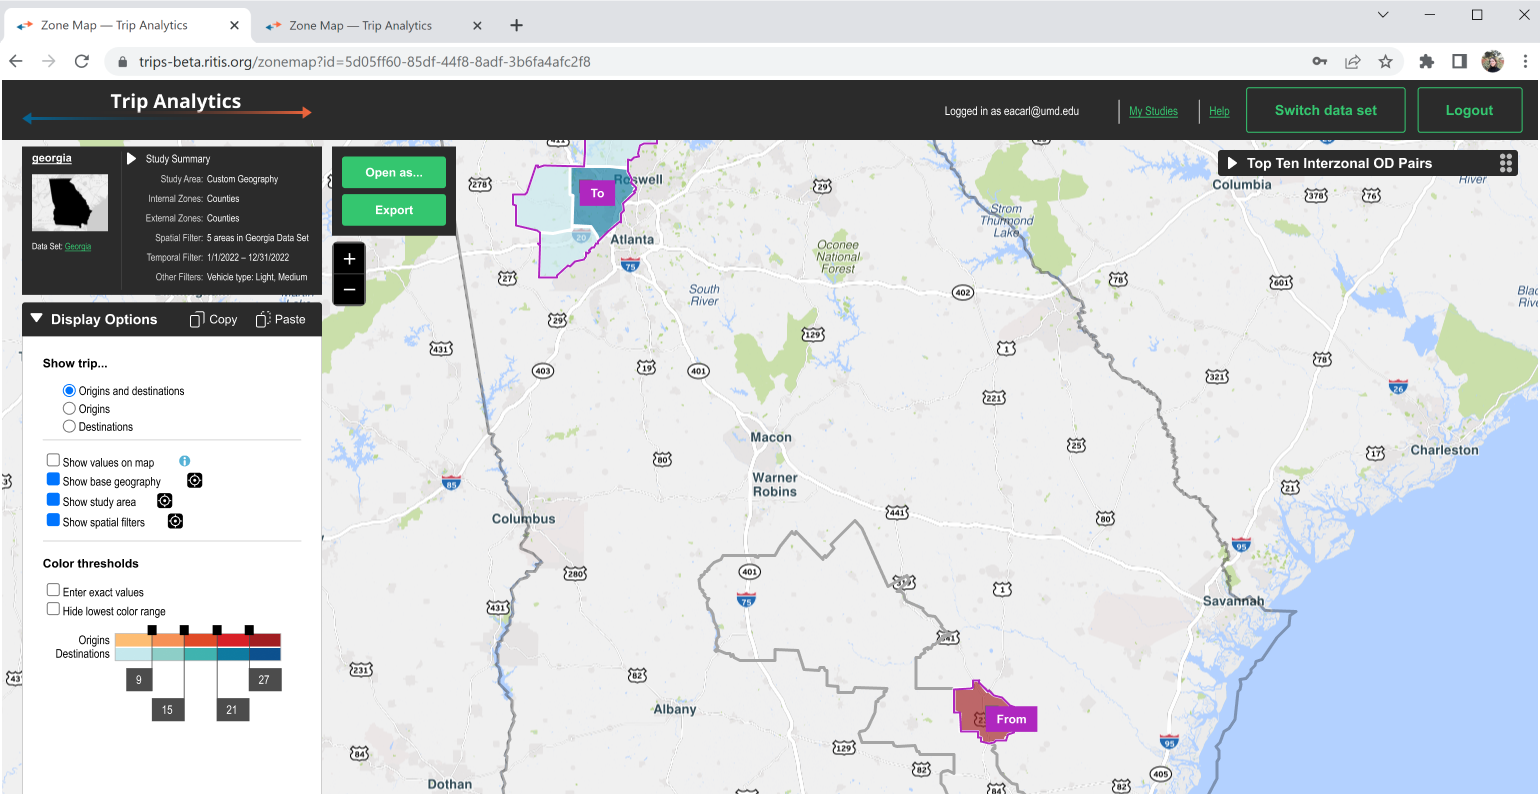
The Before: The image below is the site before the project began. In addition to designing the dashboard, I updated the header and style. I opted to make buttons and links uniform, subtler, and for an interaction pattern that keeps actions that are unrelated to analysis tucked away in clearly marked dropdowns.
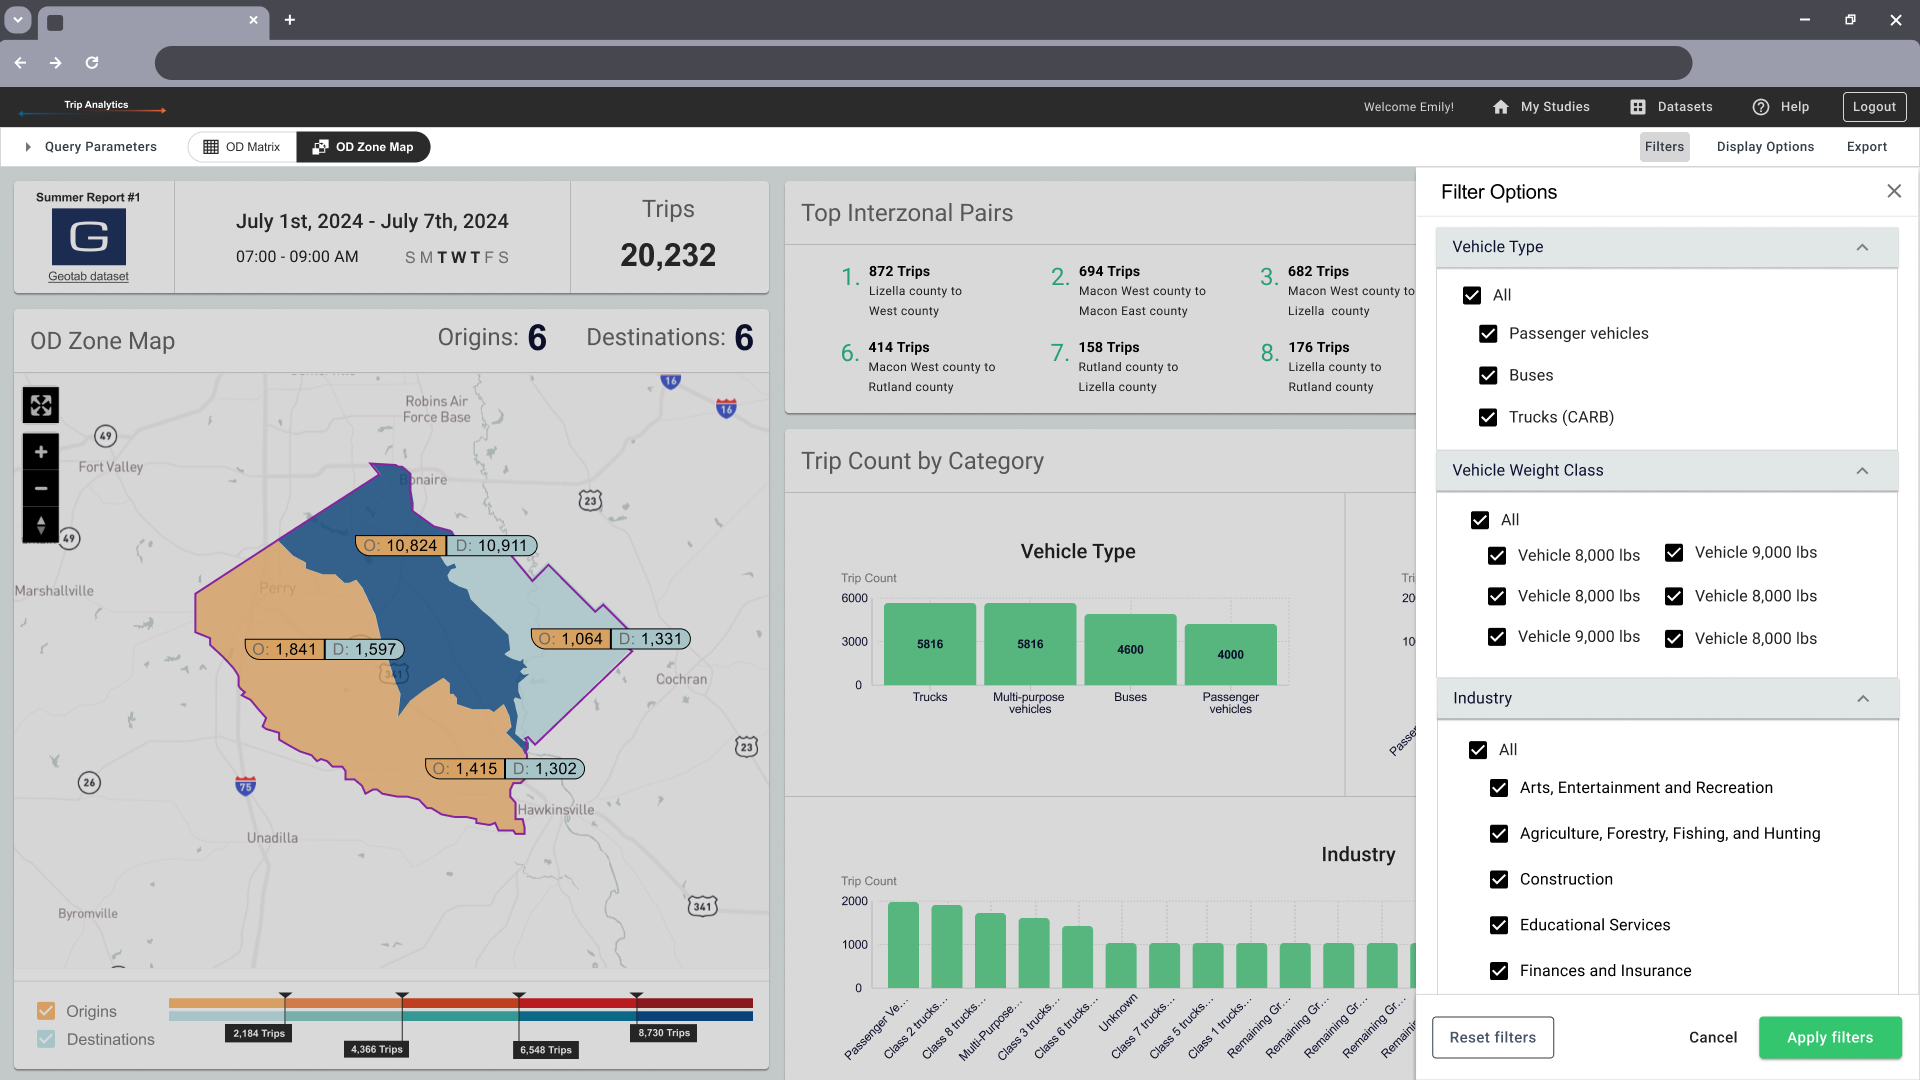
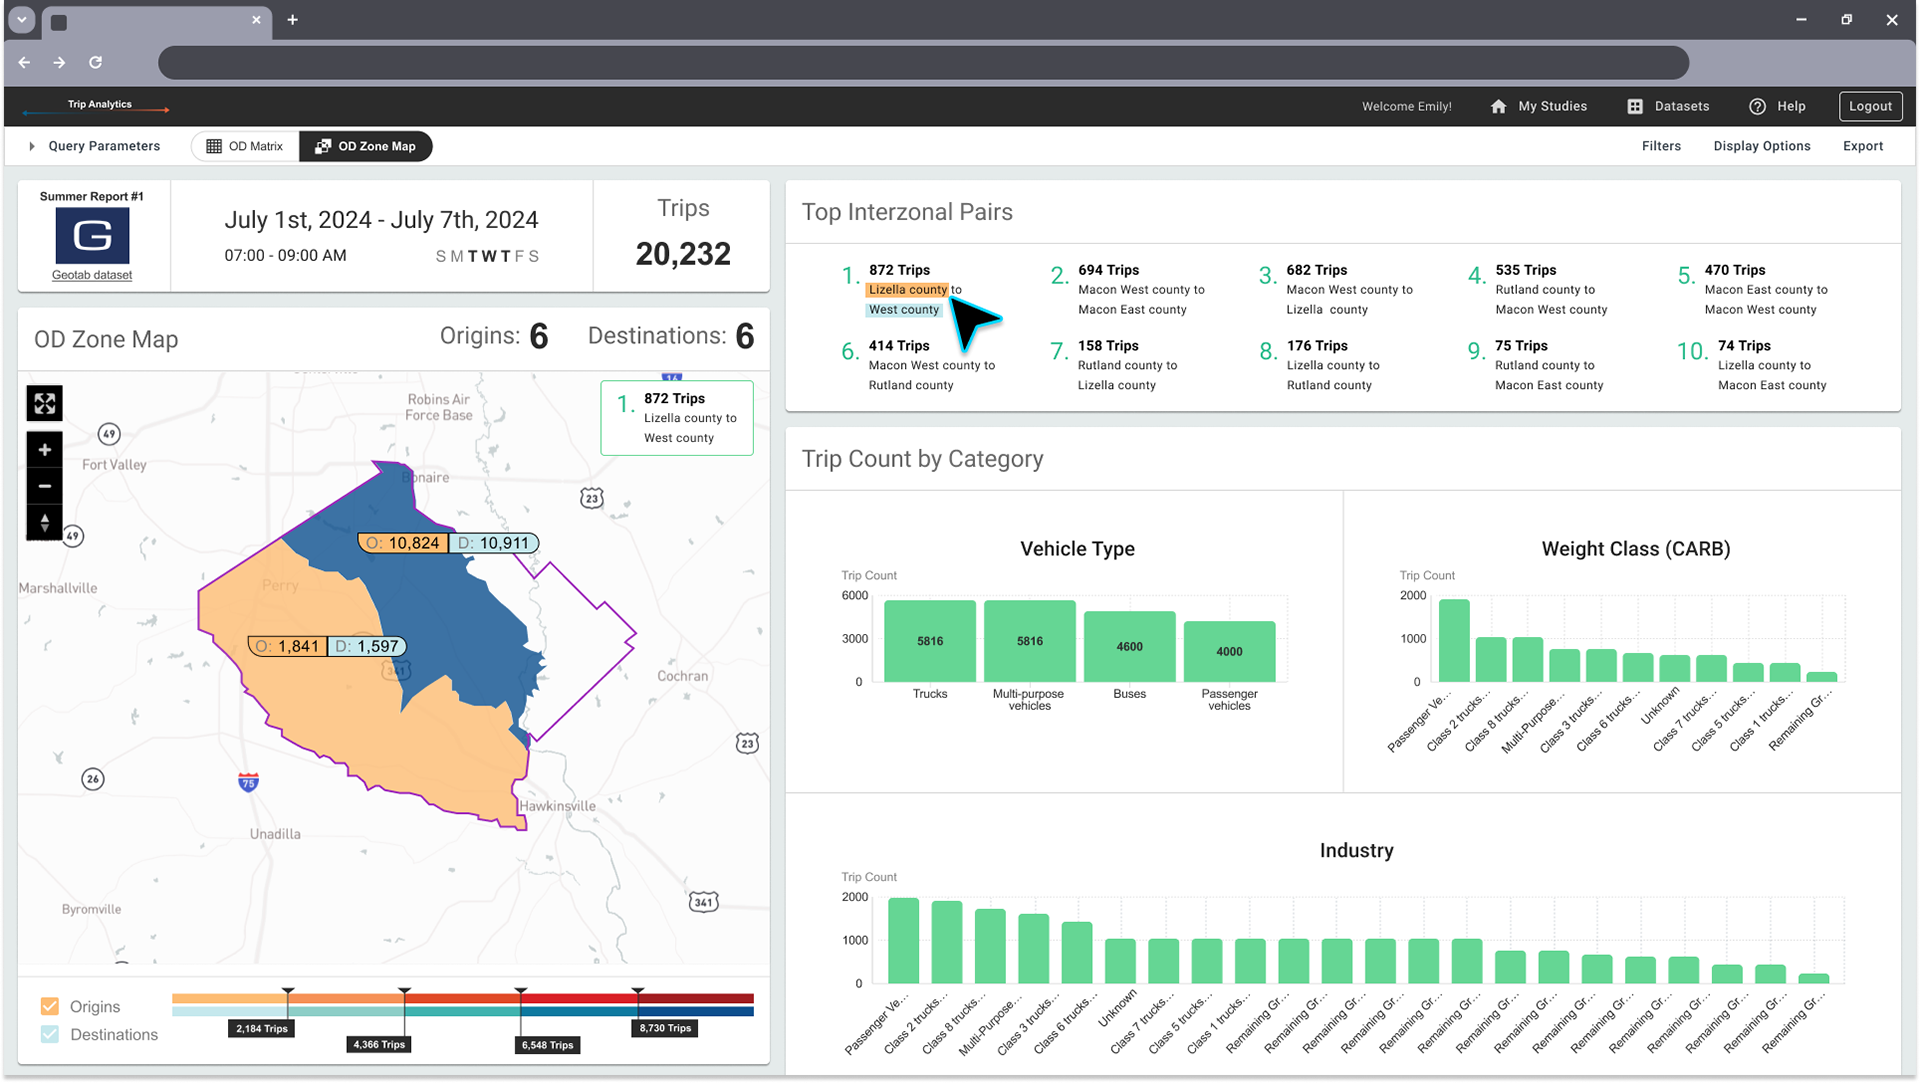
Interactions that support visualization:
Filter Dropdown: