Role: UI/UX Designer (Co-Project Lead)
Tools: Figma / Illustrator
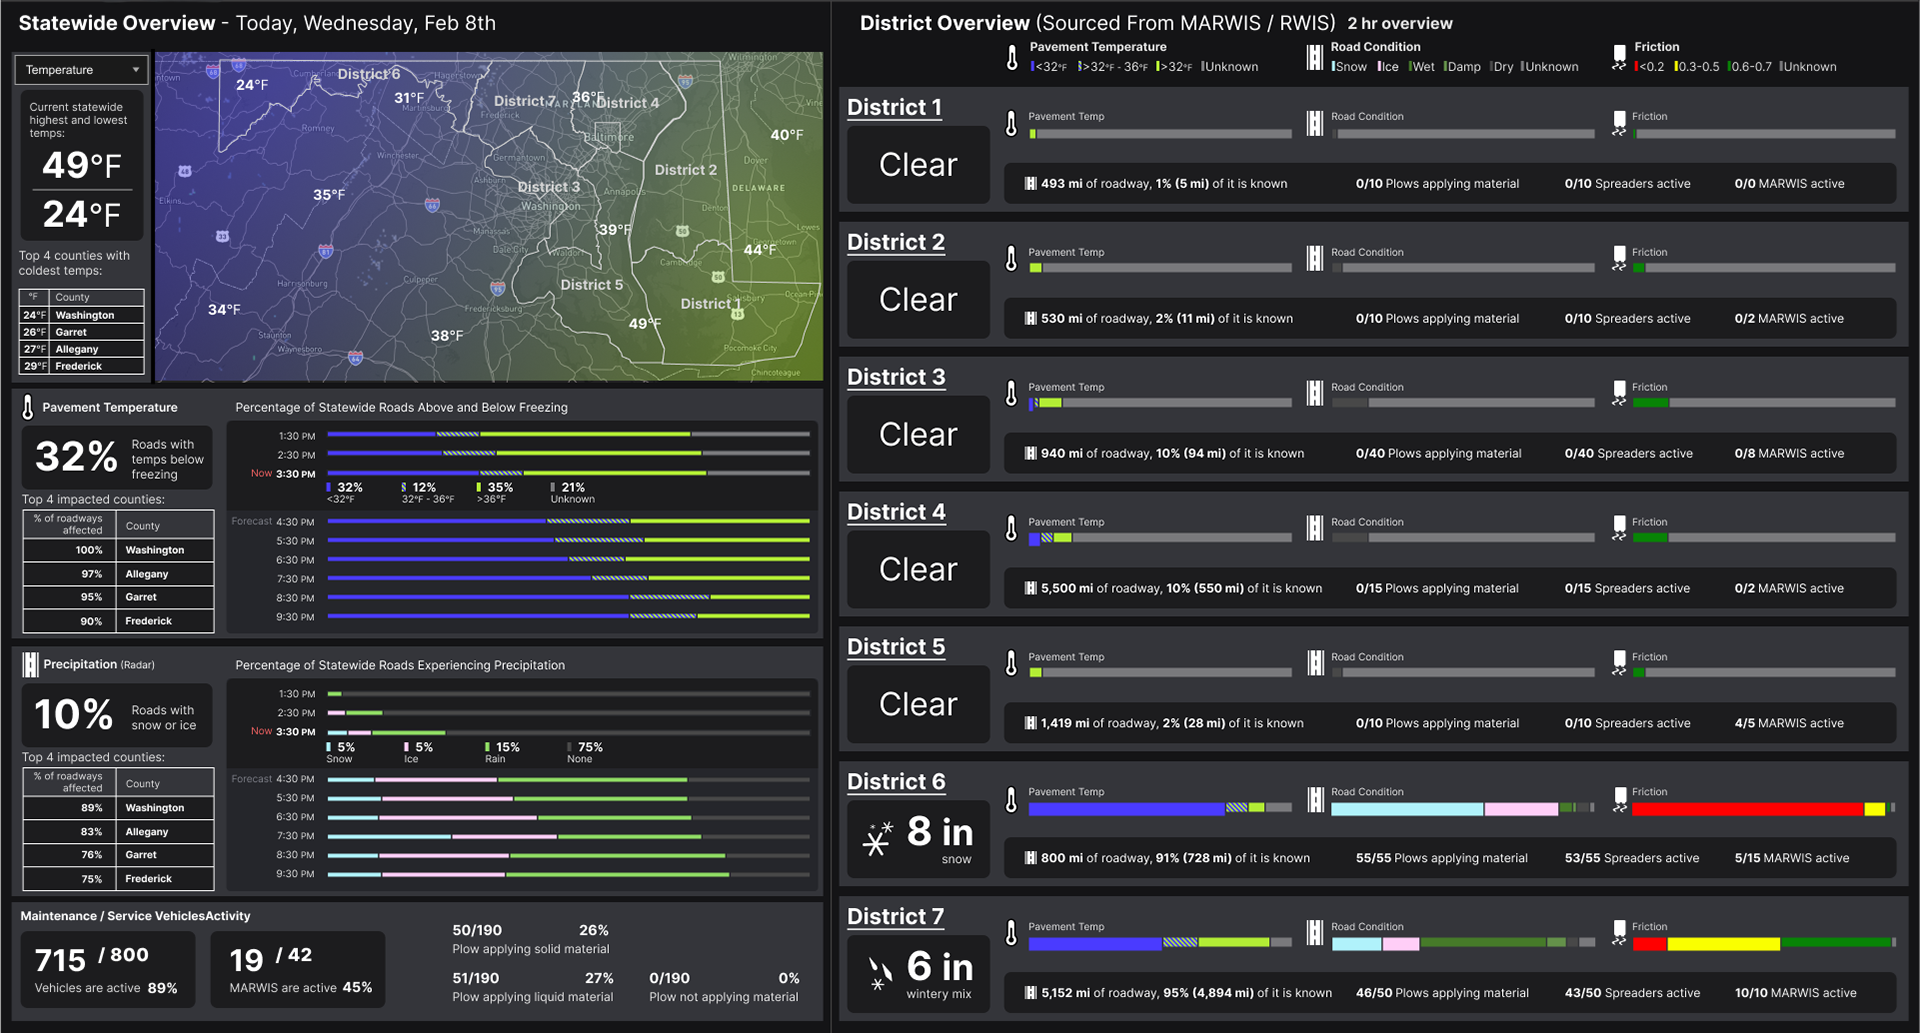
Project: The task was to design a dashboard for road weather data from mobile and stationary sensors, as well as radar. However, the focus was on mobile sensors mounted on snow vehicles. Built for operations teams, it helps track crew locations, identify areas needing attention, and anticipate road closures during storms. It provides a statewide overview, with the ability to drill down into individual districts for detailed insights.
This was a speculative concept commissioned by the Maryland Department of Transportation, and led by our Data Science Research team. Together, the research and design teams interviewed multiple Departments of Transportation to understand how they use MARWIS sensors and what challenges they face in interpreting that data.
Design: Based on those insights, another designer and I designed a dashboard product that translated research findings into a clear, flexible analytical experience. It was important that the tool could support a range of users, from executives looking for high-level trends to field teams needing detailed sensor-specific information.
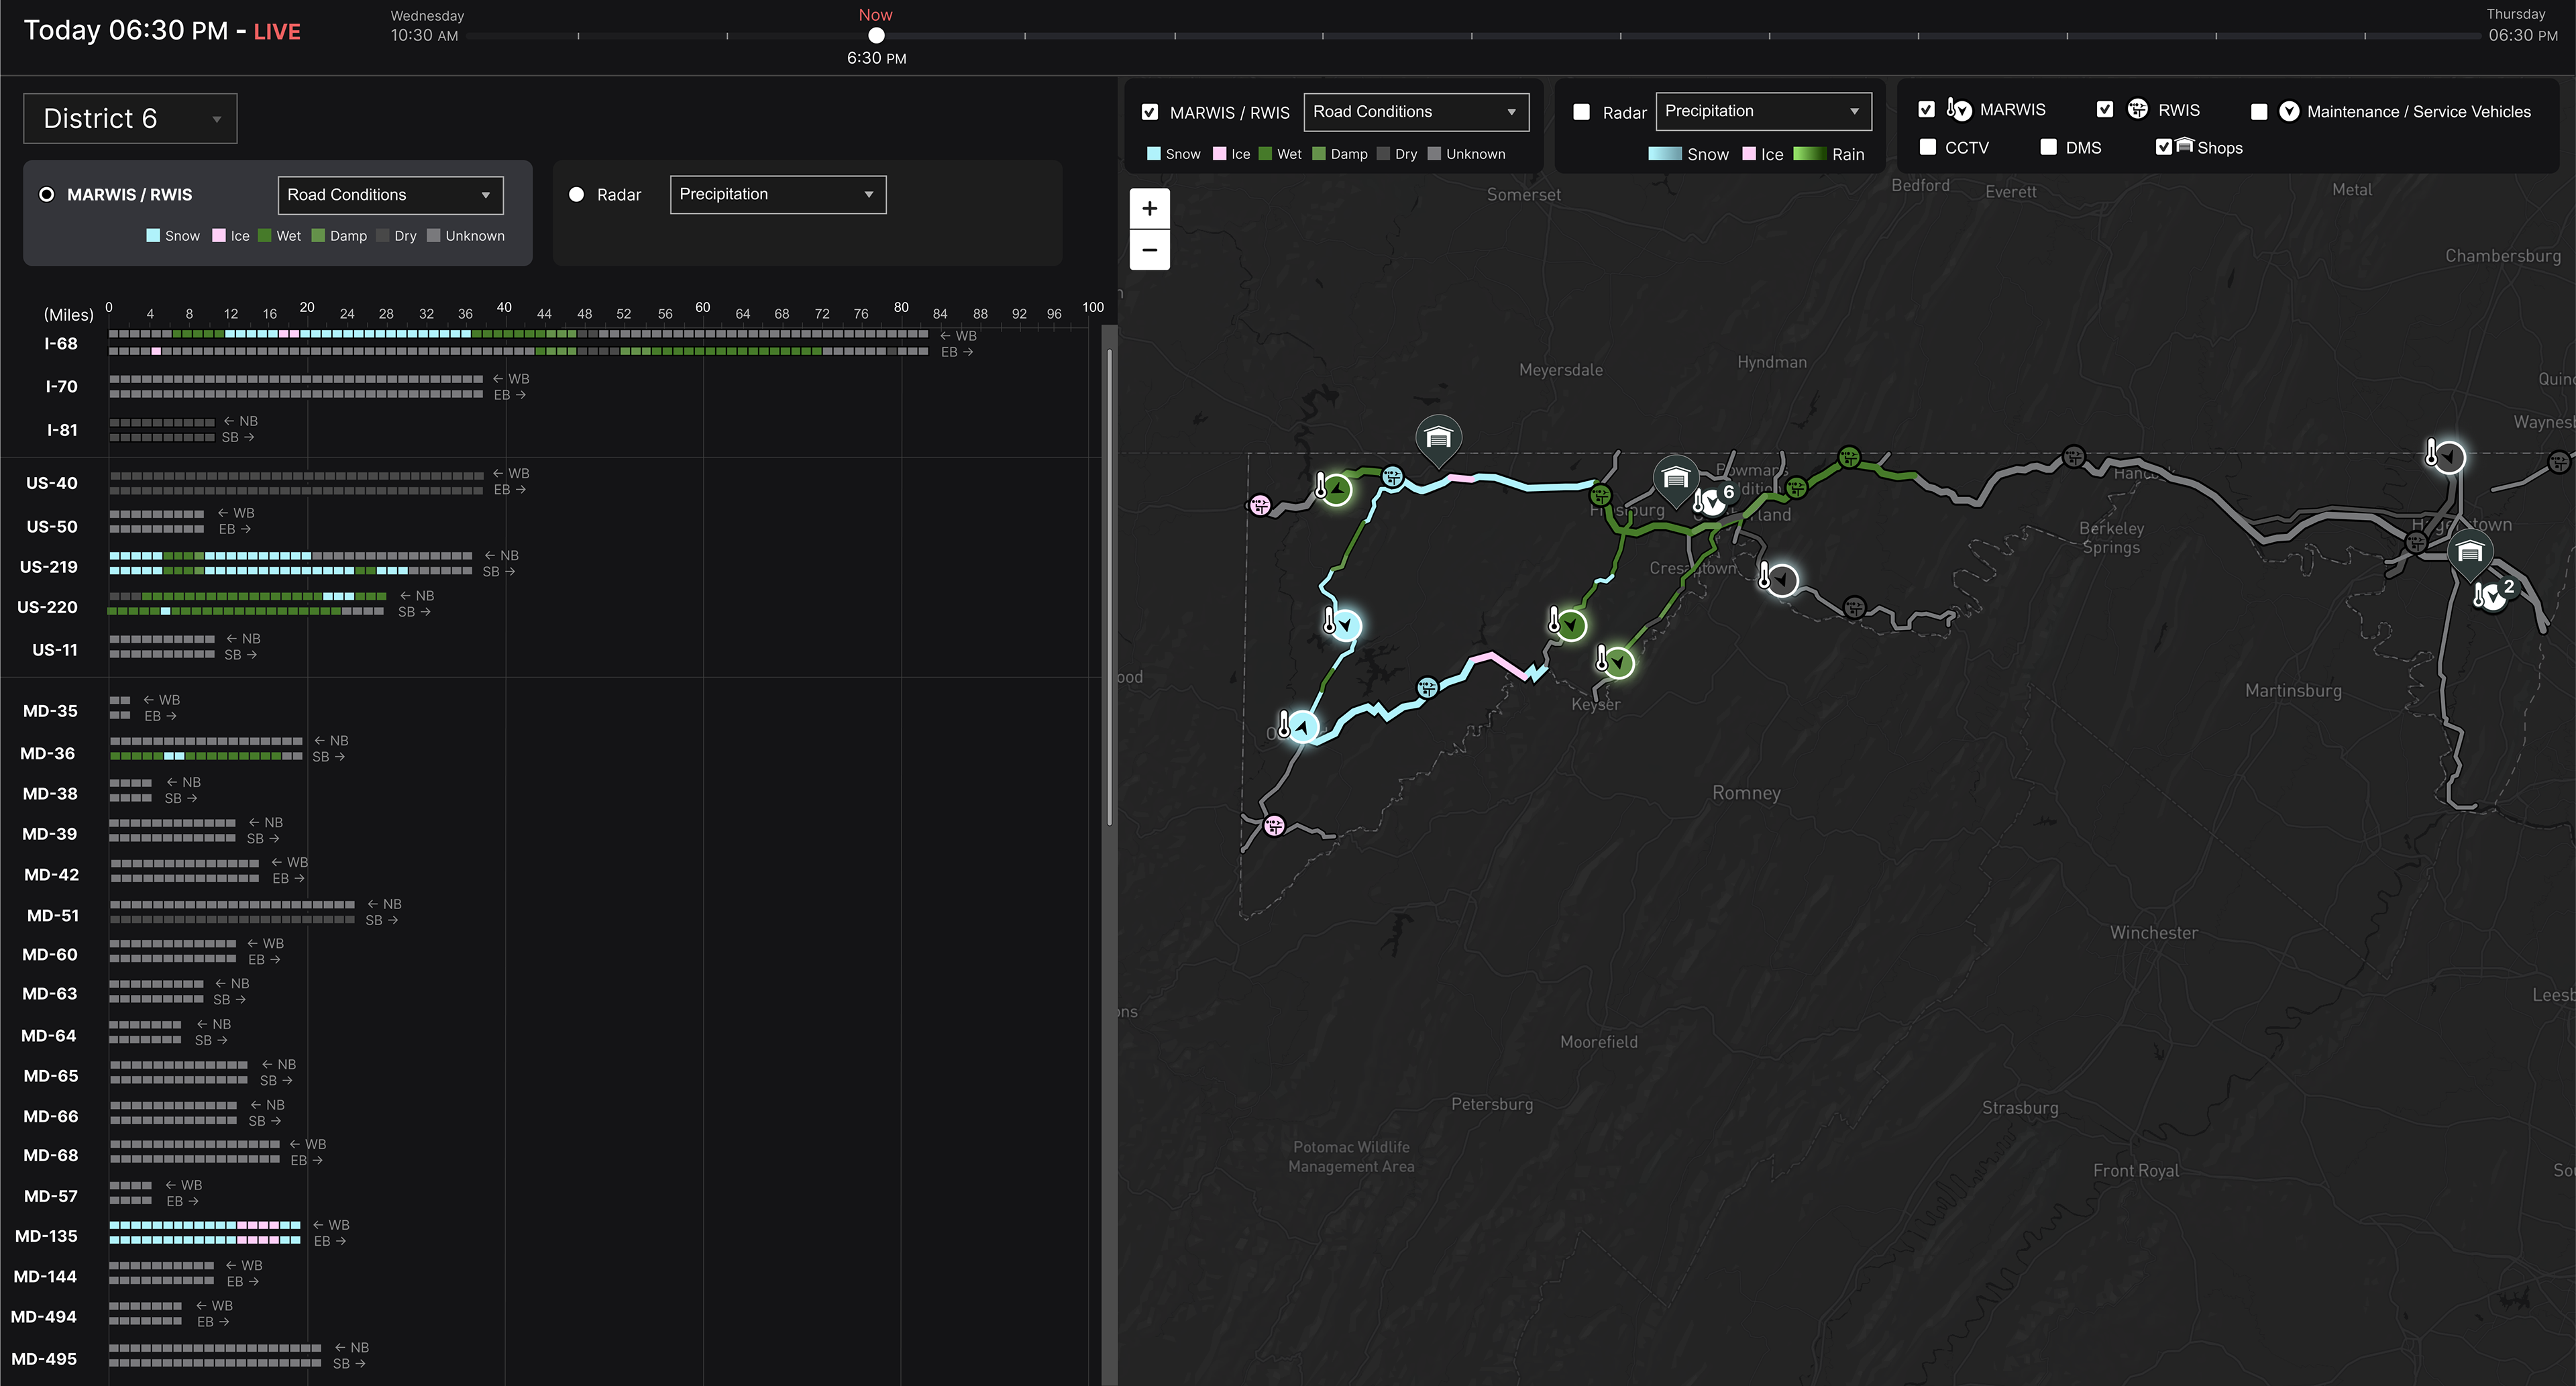
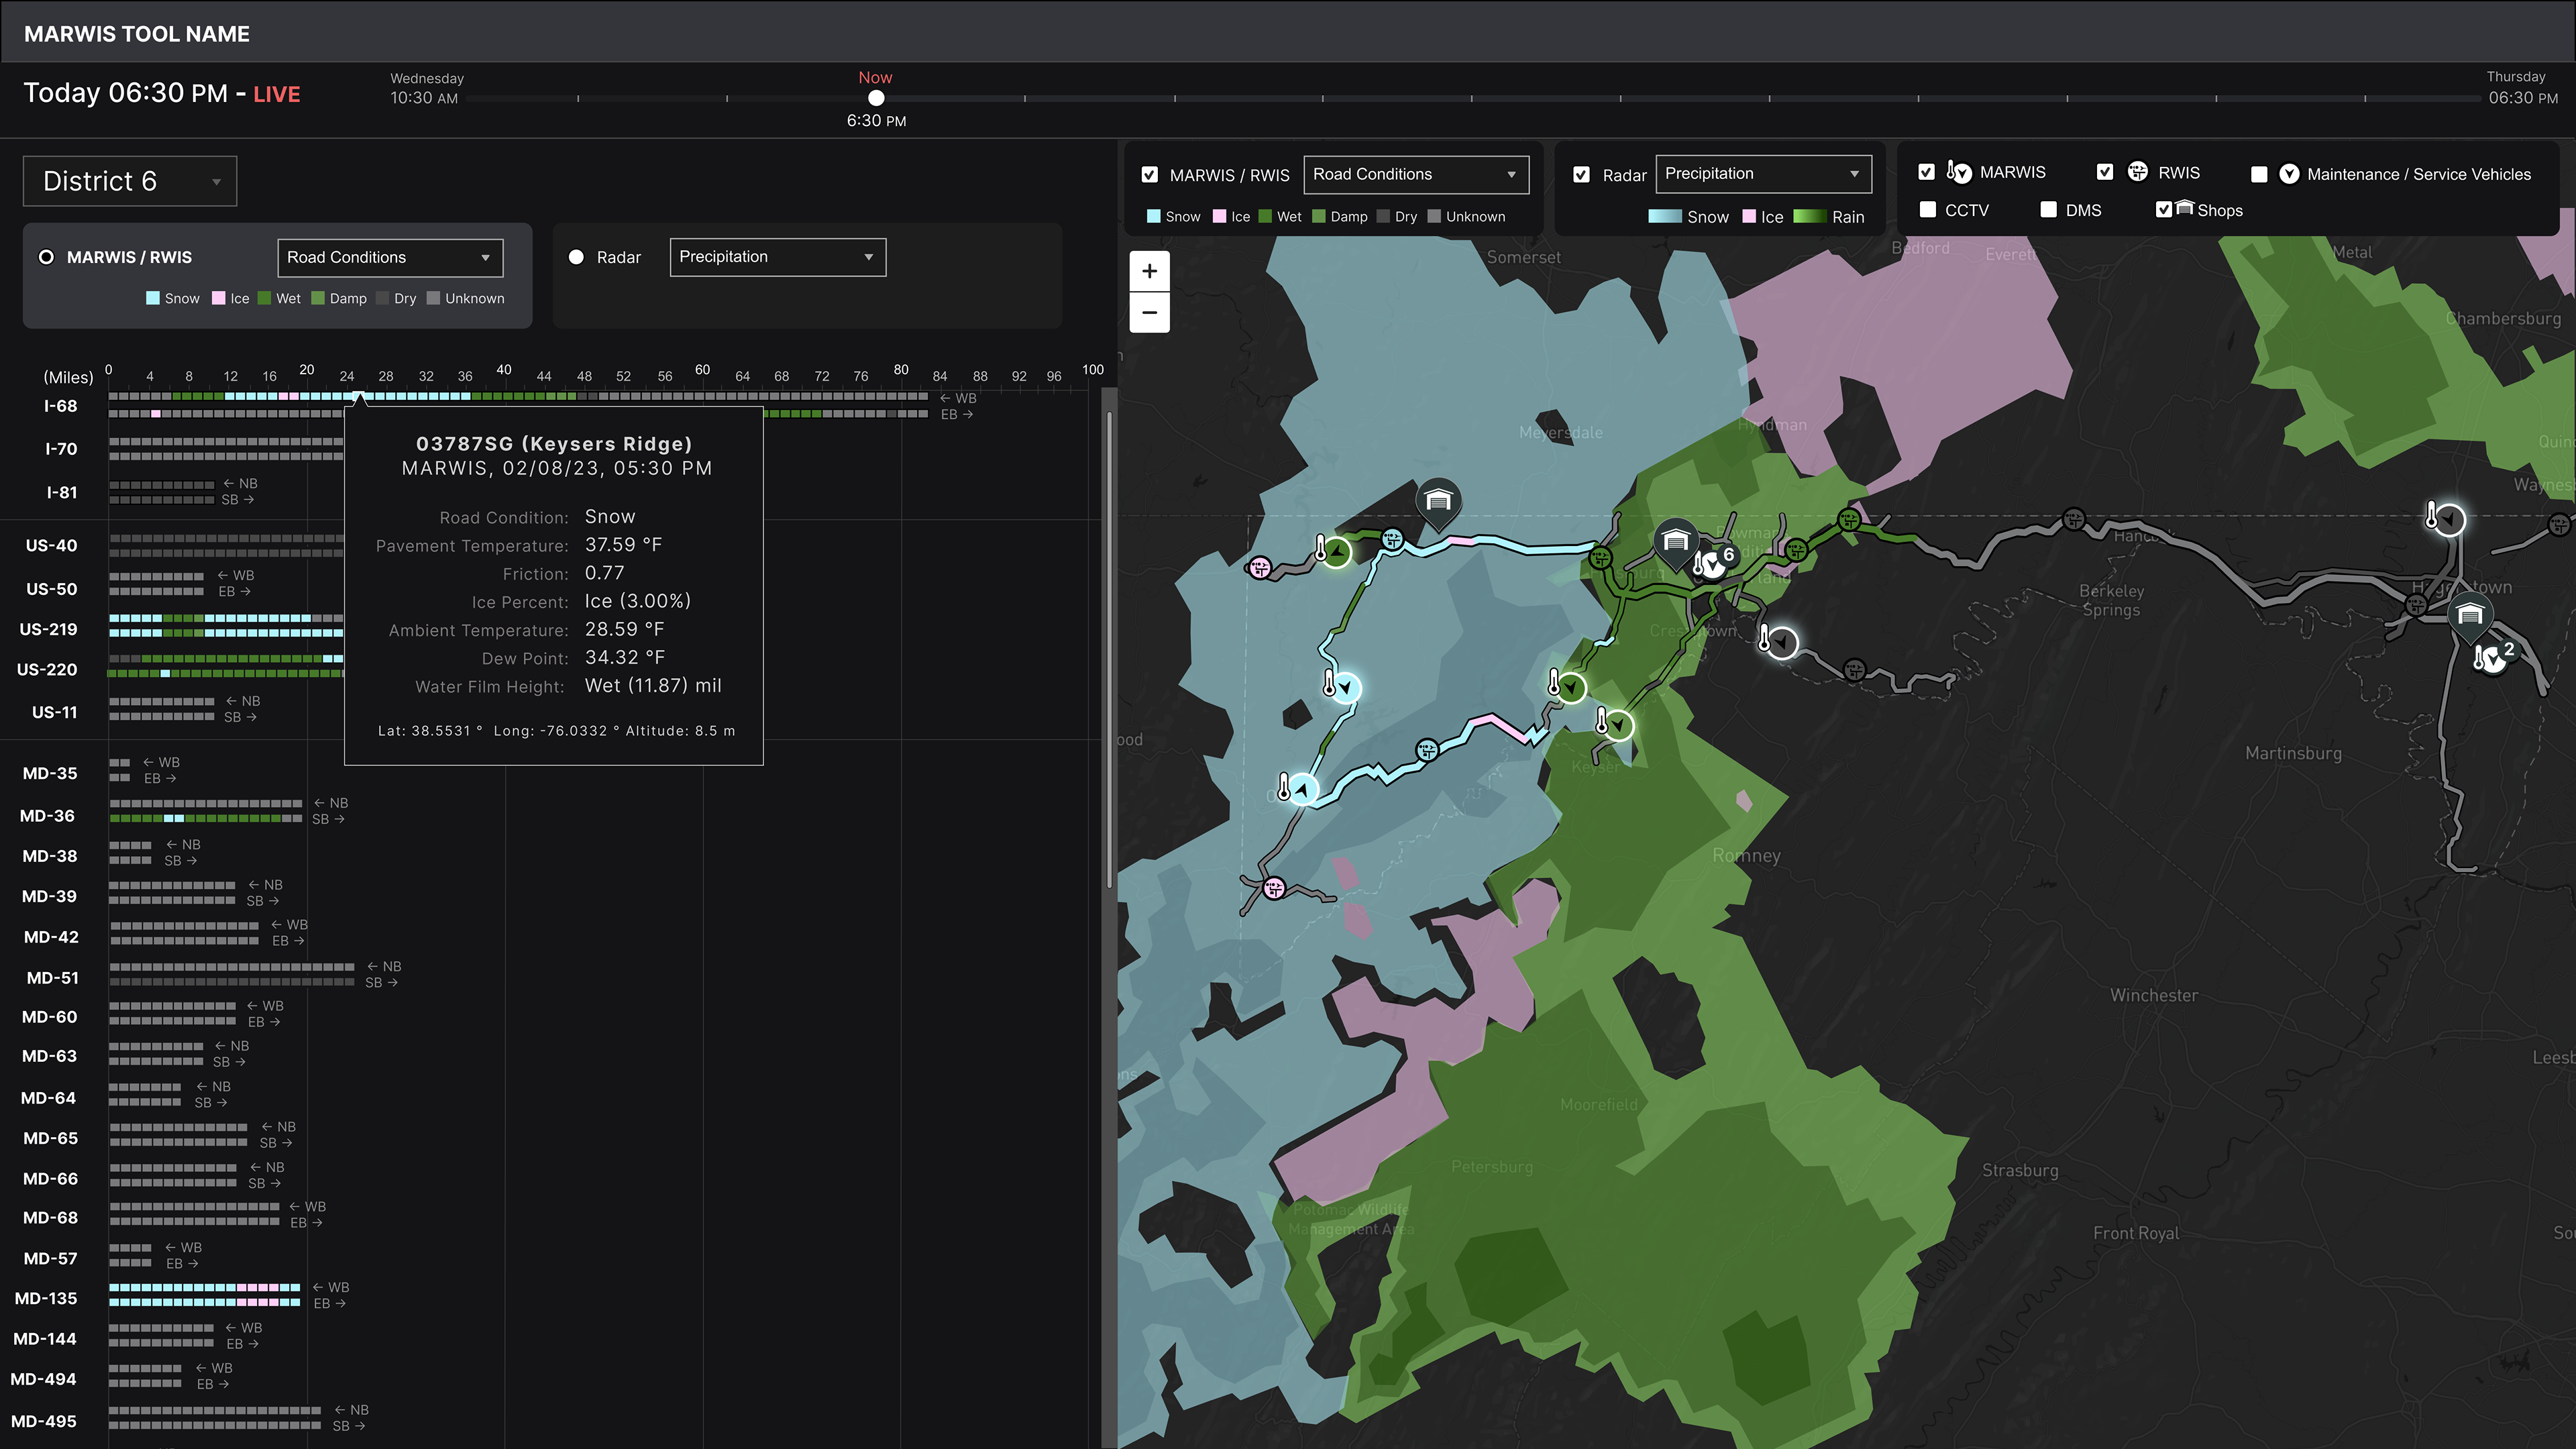
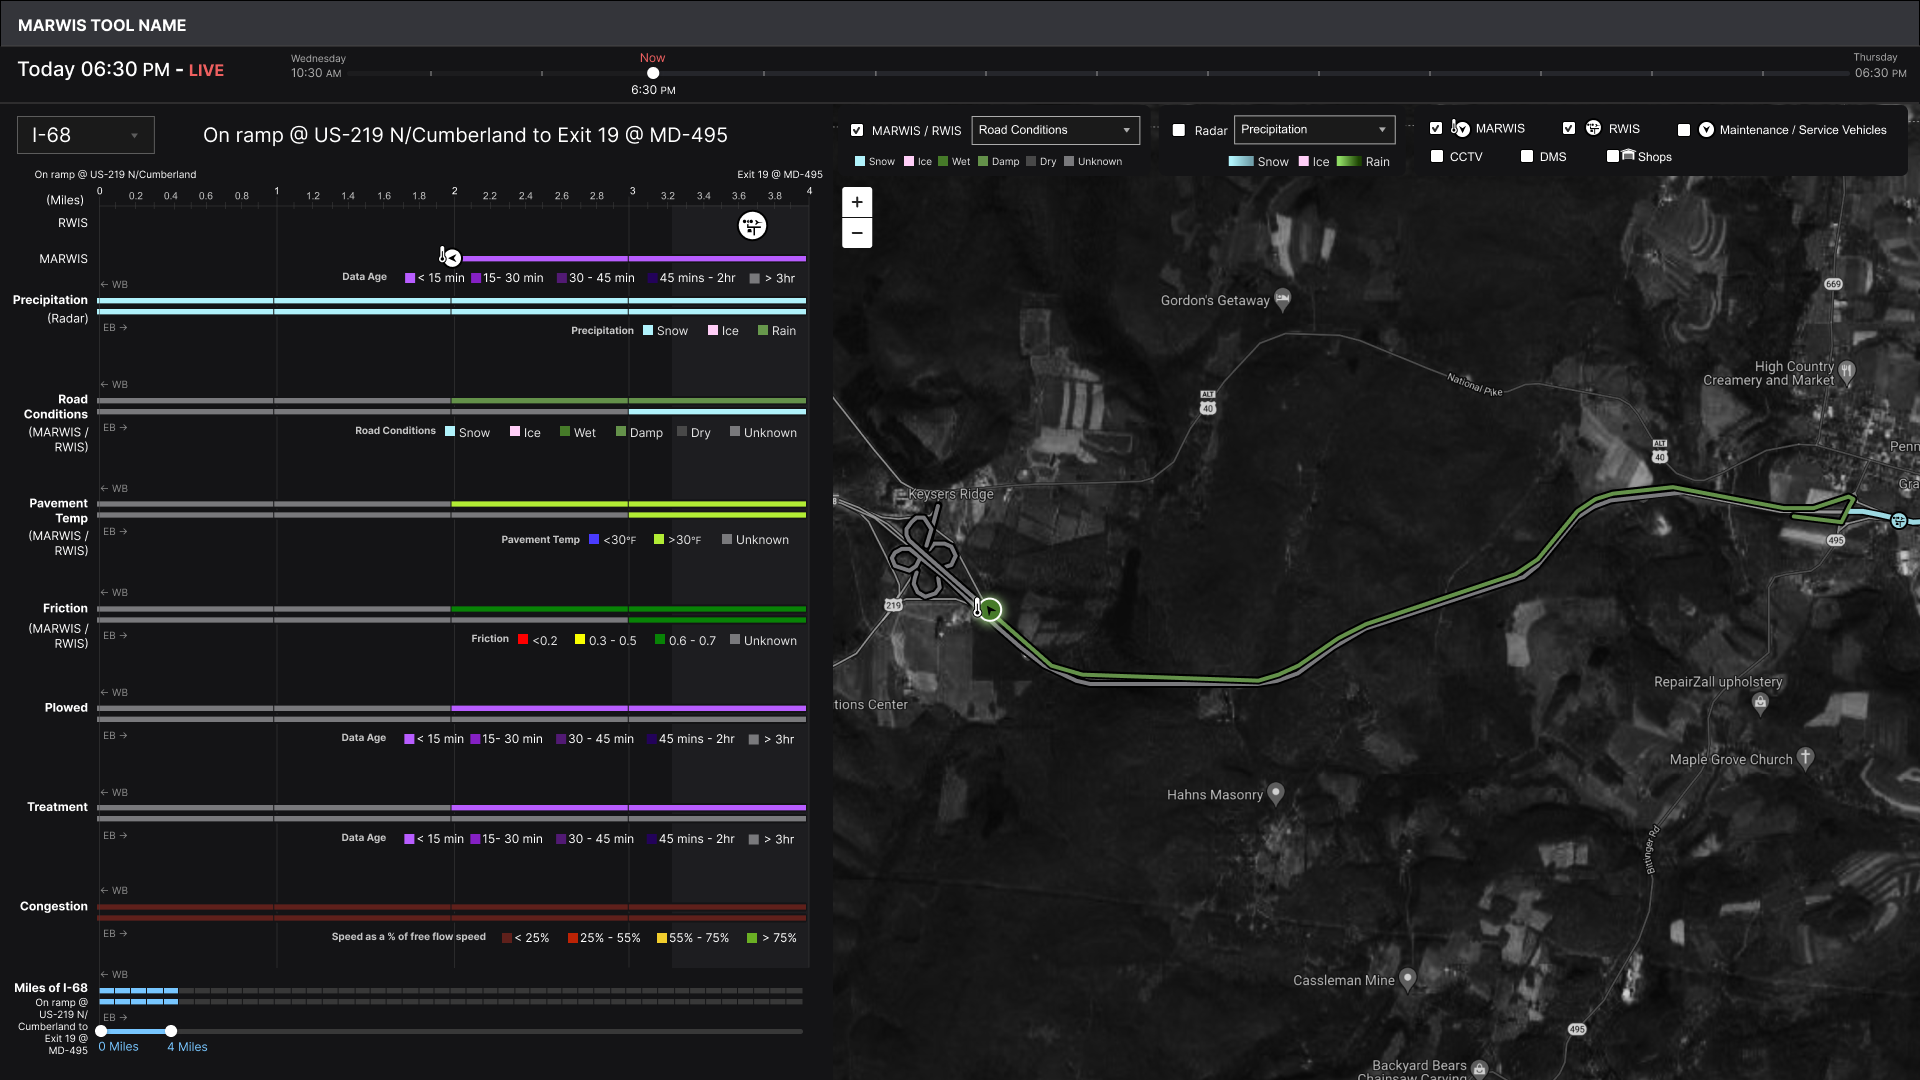
The structure of the dashboard begins at the highest-level, most zoomed-out view and gradually allows users to drill down into increasing levels of detail. The goal was to create a natural analytical flow, guiding users from system-wide patterns down to a specific MARWIS sensors that might require closer investigation.